[INFOGRAPHIC] 2011 Beer Industry Courtest of @WSJGraphics – a quick look at the beer industry in 2011. Overall, beer volume has declined, despite a 16.4% rise in the craft sector. (Big beer has a big chunk, & they’re down on the year.) by Reid Ramsay December 29, 2011
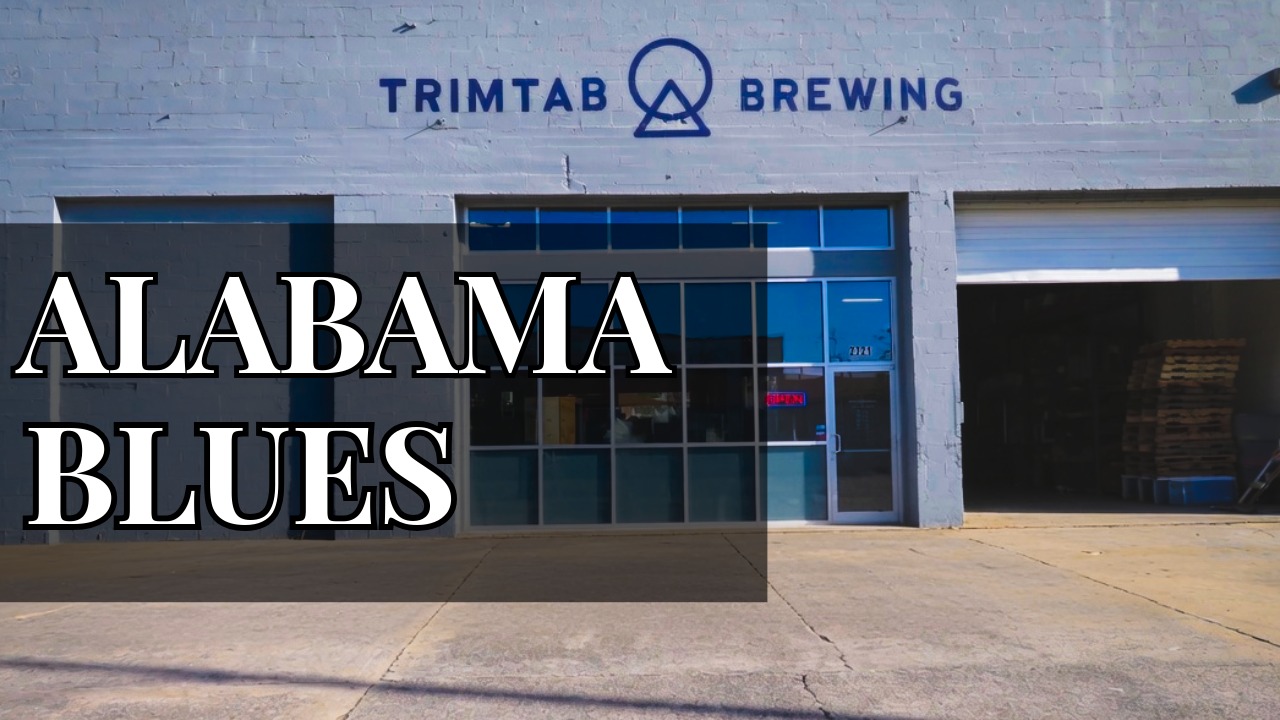
Beer News, Brewery Closures, Headlines, Trim Tab Brewing TrimTab Brewing Closing the Tasting Gallery July 4 After 13 Years
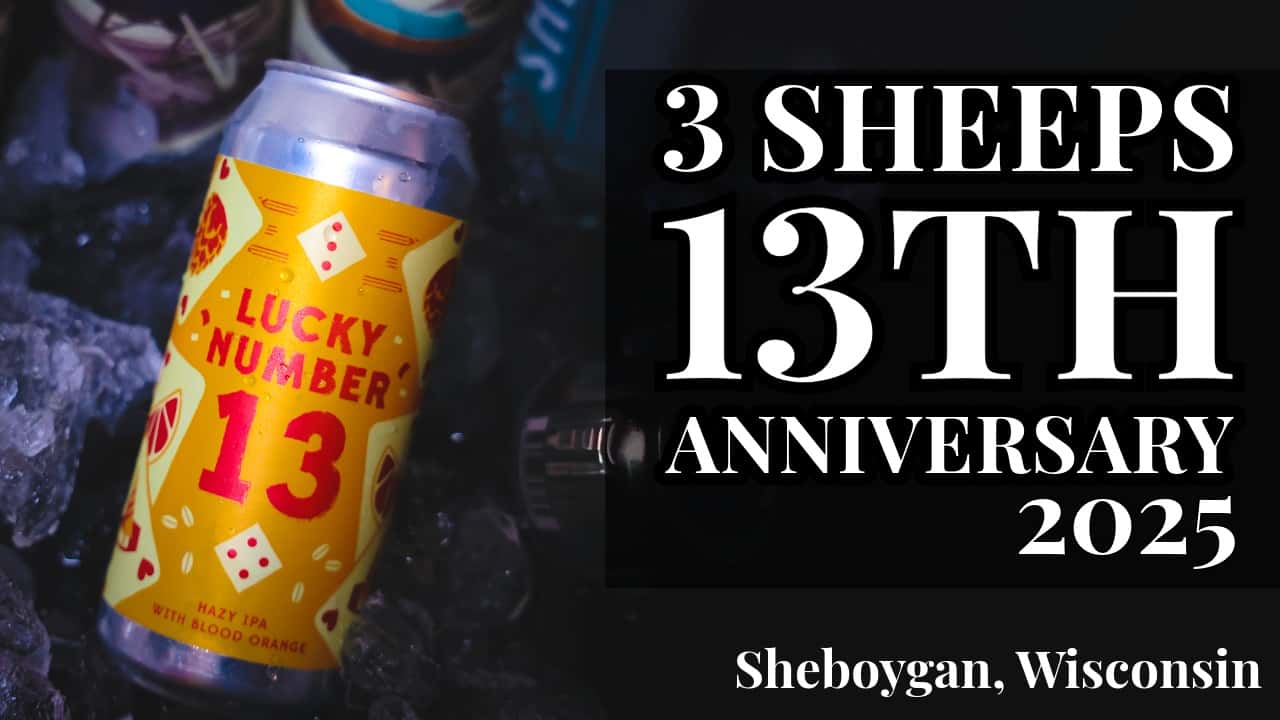
3 Sheeps Brewing, Galleries, Headlines 3 Sheeps Brewing turns 14 tomorrow, check out last year’s party (PICS)
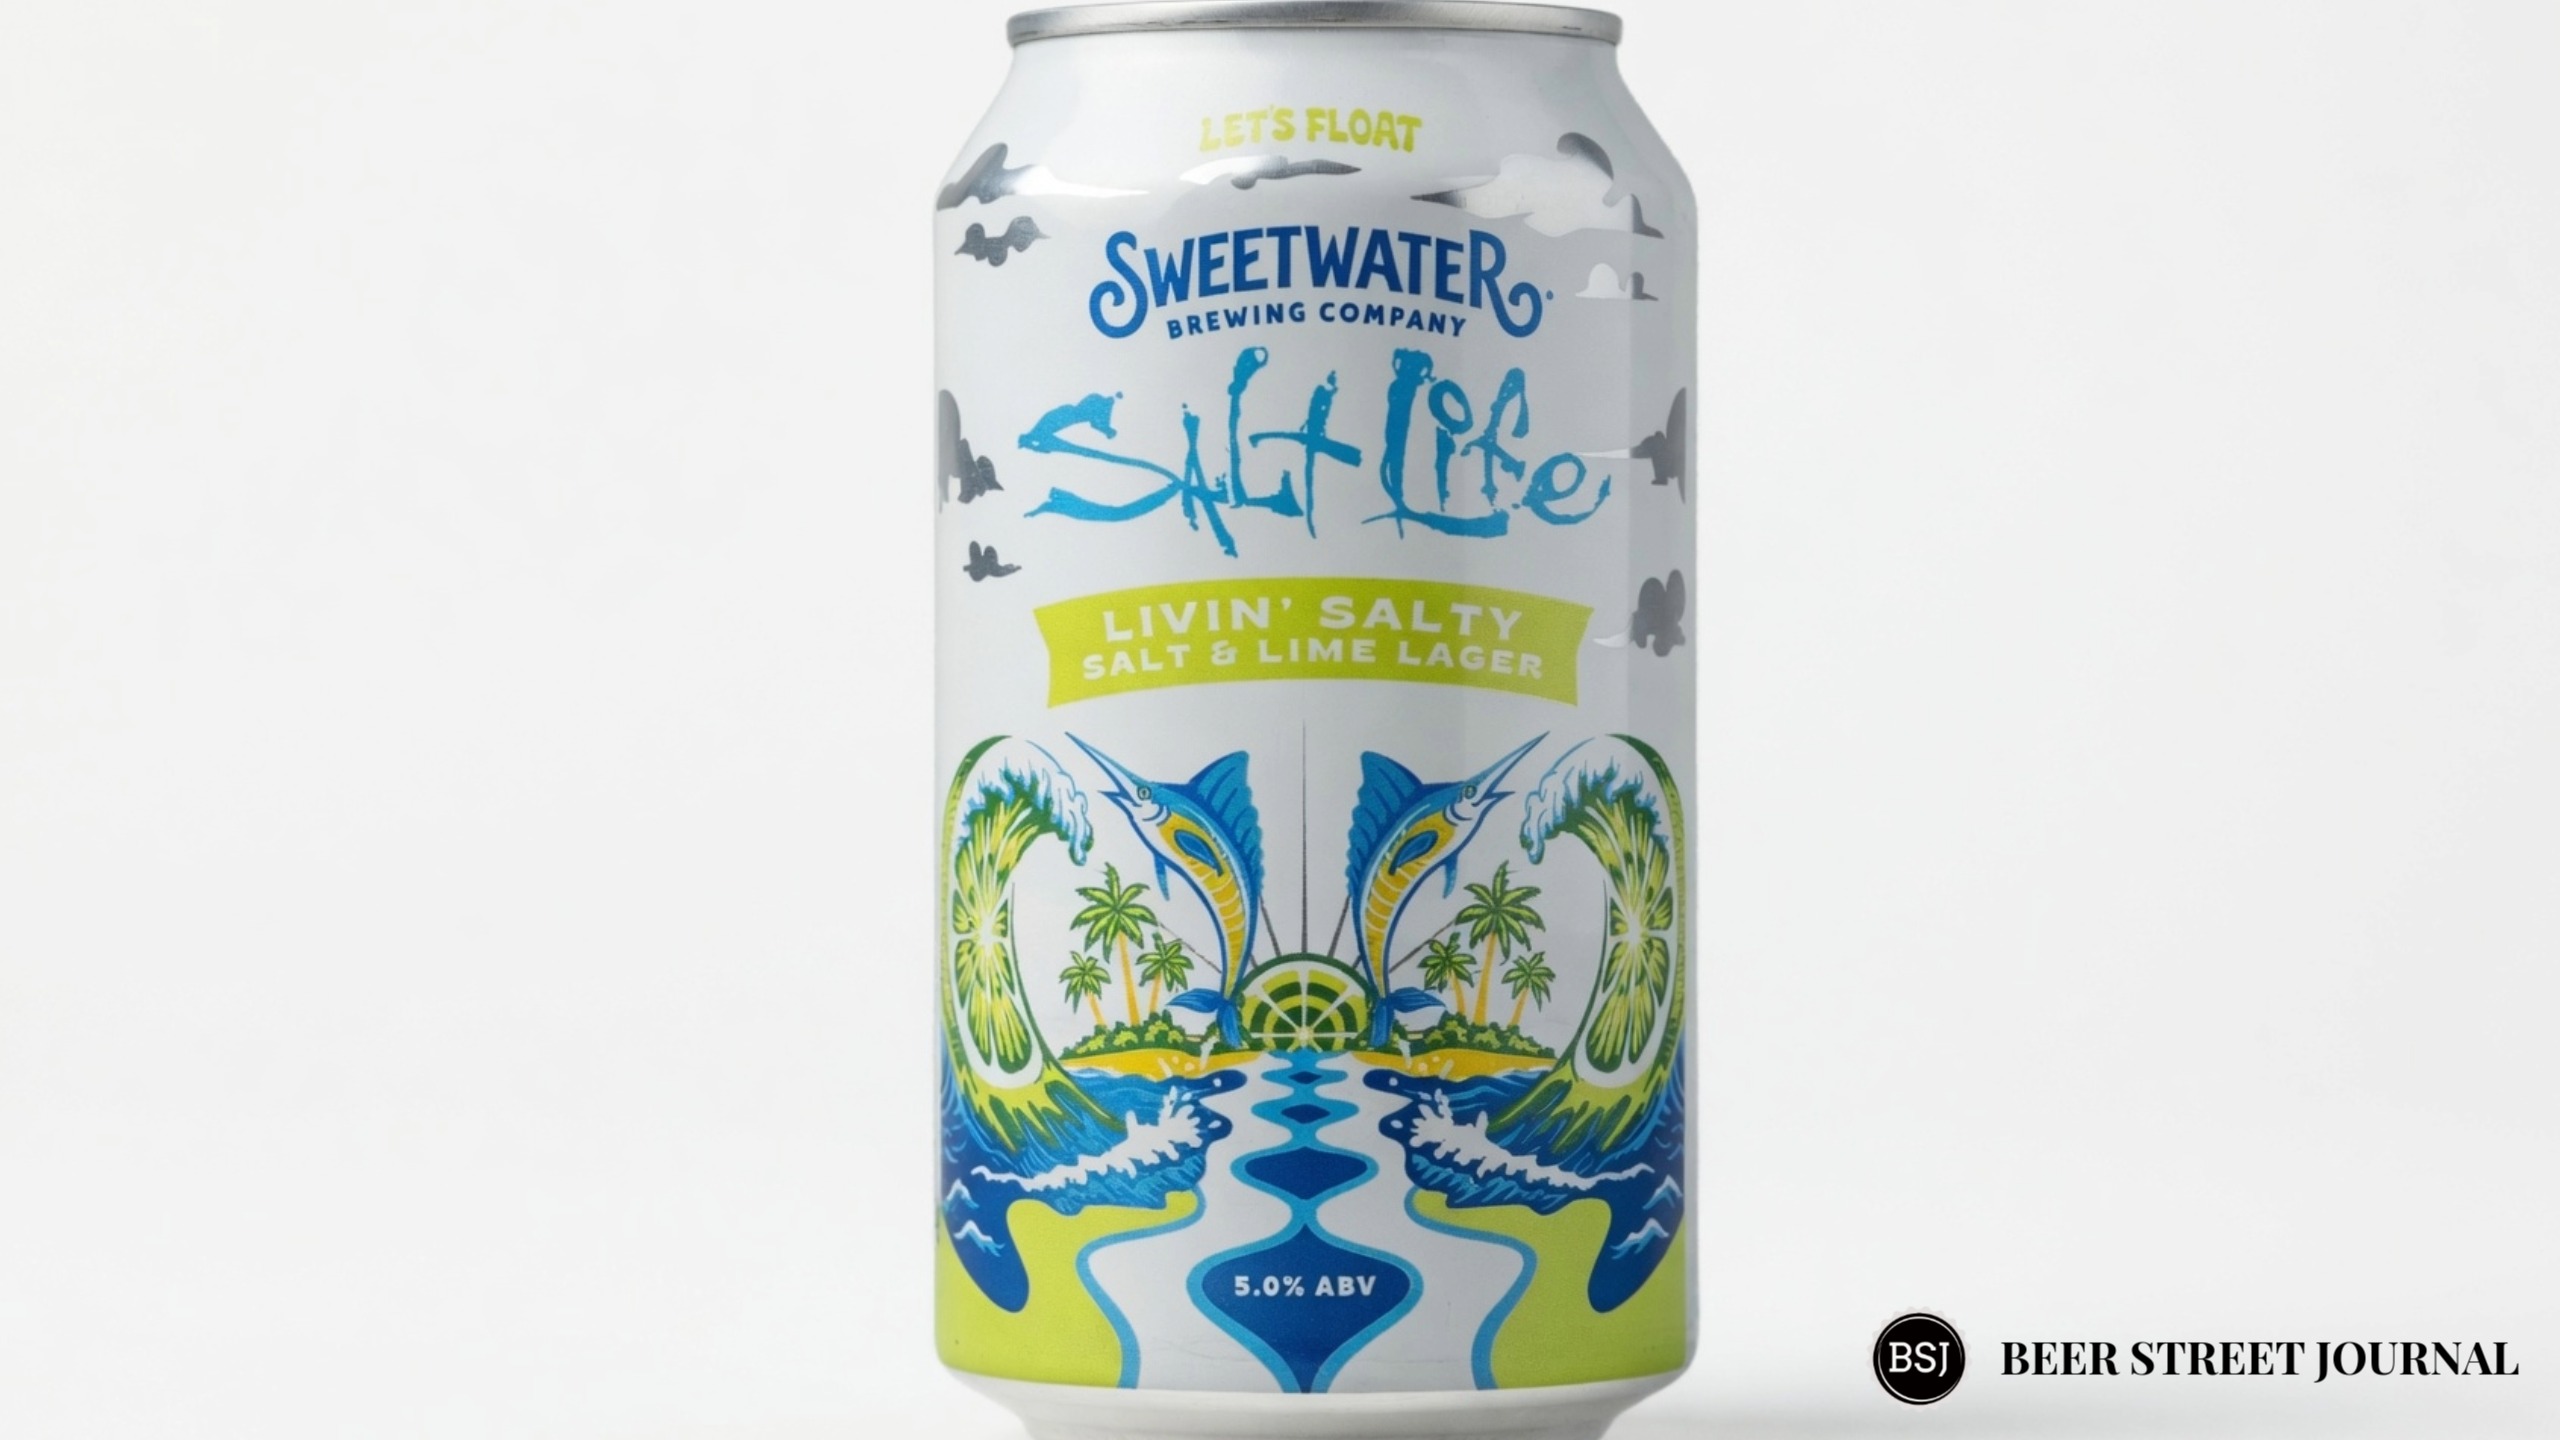
Headlines, New Releases, SweetWater Brewing SweetWater Livin’ Salty, a collaboration with Salt Life drops
 Courtest of @WSJGraphics – a quick look at the beer industry in 2011. Overall, beer volume has declined, despite a 16.4% rise in the craft sector. (Big beer has a big chunk, & they’re down on the year.)